Introduction
The history of the printed maps of Devon is very much a story of the development of the Atlas in Great Britain. Many of the maps were first printed for sale on single sheets. However, when a series was complete the sheets would be collected together to form atlases or topographical works of England, England and Wales, Great Britain or the United Kingdom. Over eighty of the maps illustrated here were considered as part of such an atlas: originally printed with the idea of covering the whole country in a comprehensive work to be bought first by the landed gentry and later by the affluent middle class. The remainder were either produced as cards, usually playing cards or some game, or to accompany a work specifically covering Devon, such as an agricultural review. A smaller number are parts of unfinished series.
Our aim has been to compile a definitive list of the printed maps up to 1837. Queen Victoria’s accession is a convenient break point in the development of maps in Devon, just before the advent of the railways and the plethora of lithographic maps.
We hope this short introduction to the early mapping of the county will also help those who are not familiar with printed maps and explain some of the techniques, problems and terminology.
Printing
The first printed maps of the 15th century used the wood-cut, a relief process where the back is cut away leaving the design raised. This was ideally suited for the early books for it needed no greater pressure than the moveable type-face and was easily incorporated onto the printed page. The wood-cut was extensively used until the middle of the next century and maps of England or Britain by such cartographers as Martin Waldseemüller and Sebastian Münster are fairly common. Both the National Maritime Museum and the Royal Geographical Society have examples of woodcuts showing the entrance to Plymouth Sound but woodcuts were not employed for county maps even when the technique was revived in the 19th century for magazines and encyclopaedias. No true woodcut map of Devonshire is known. The only copy printed from a wood block is William Pinnock’s fascinating map from The Guide to Knowledge (108). This had the map engraved into the wood resulting in a ‘reversal’, showing white lines on a black background.
It was copper plate engraving that dominated the reproduction of maps for some three hundred years. The technique had long been developed in Italian art and it was ideally suited to reproduce the fine line of the draughtsman and surveyor. Here the design is cut into the metal, the plate is then inked and wiped clean, leaving the ink within the incised lines. Passing the plate through rollers under pressure ‘lifts’ the lines onto the paper. These inked lines stand proud of the surface, and can be felt on today’s bank notes, where the method is still used. As this technique uses pressure the paper often bears evidence of the edges of the copper plate. It had many advantages over the wood-cut. The engraver could work much faster and could use many other techniques: dots, pecked lines, stipples and lettering of greater fluency - for example the Mercator-style flourishes used by Jan Jansson (11) to fill empty areas or sea. Changes too were that much easier; lines could be burred or hammered out and re-engraved. The Dutch mastered this technique early on and Christopher Saxton employed Flemish engravers for most of his maps, for example Remigius Hogenberg who engraved the map of Devon. He also employed a few local artisans who soon developed their own style and techniques including Augustine Ryther who signed his work Anglus. In the seventeenth century other refugees engraved or published important maps, such as Pieter van den Keere
Herman Moll (25) and John Rocque (28). Although some English engravers such as Emanuel Bowen and Thomas Kitchin became proficient and were highly admired, British supremacy in map-engraving really began in the late 18th century with John Cary standing out among the many (51, 54, 69, 71, 79).
Copper engraving had the major disadvantage of eventually wearing down so that strengthening of incised lines was needed or even a new plate, as can be seen with some of John Cary’s maps. Cary’s New and Correct English Atlas (51)was re-engraved (73), and his Traveller’s Companion (55) was re-engraved twice (69 and 92) although the second plate might have been lost in a fire. Sometimes it is possible to detect thickening of lines (6.9) or see cracks in the plate (see p.13). Not until the 1800s was it possible to engrave on steel. This allowed a longer print run; hence maps engraved on steel are more common. James Pigot’s series for his Directories from the mid 1820s were the first to employ this technique (98).
Acid etching was introduced in the 1800s and, though giving the designer much greater flexibility, was not often used for maps. Here the design is cut through a wax coating applied to the plate; the plate is then immersed in acid which eats into the exposed copper, creating the etched image. Etched lines tend to end square or blunt, whereas the engraved line tapers to a point: Wenceslas Hollar’s famous Quartermaster’s Map is a good example.
Lithography was invented in 1798. It was found that in drawing with special greasy ink or crayon on a flat limestone slab the grease was absorbed; the image would then accept printer’s ink which was repelled by the rest of the stone, provided the surface was kept moistened. The technique began to be used in 1820 and in the map trade in the late 1830s. Although at first sight similar, it can be distinguished from engraving by the absence of raised lines and especially the plate block mark. Its use developed rapidly and enabled changes to be easily and quickly made. A number of maps originally engraved were later reproduced as lithographs. Some of Cary’s maps were republished by G F Cruchley (73 and 92), the Ebden (95) and Teesdale (99) series are also good examples. Pigot’s series of small maps was produced in this fashion (114).
Paper
Until the 19th century paper was hand-made from finely chopped rags pulped in water. A wire mesh screen was dipped into the mix attracting a thin layer of the pulp. The water was drained off, the sheet partly dried then removed and hung until completely dry. The lines of the mesh, including any water-mark motif, are clearly visible when the sheet is held up to the light. In the second half of the 18th century the wires were replaced by woven brass cloth and the lines disappeared, although the paper-makers still used their wire watermarks. Copies of Saxton are known with a number of different watermarks (see p.4) and copies of Richard Blome’s maps (14) have a jester watermark like the joker found on playing cards. This ‘fools-cap’ is said to have given rise to the paper size.
The maximum sheet size of the paper was about 700 by 800 mm (24" by 28"), determined both by the practical size of the screen and the printing presses. This standard sheet produced the various book sizes. A once folded sheet is folio, folded twice into four pages is quarto, folded again is octavo, twice folded is duodecimo, and octavo folded is sextodecimo (75 by 87 mm or 3" by 41/2"). But even here the sizes vary to suit plate and publisher. The largest single sheet maps of Devon are those of Emanuel Bowen (37) with sheets measuring to 580 x 745 mm and the Greenwoods (97) at 650 x 780 mm. Disregarding the playing cards and similar, a number of maps compete for the prize of the smallest Devon map: Mathew Simons (9) with a map size of 40 x 35 mm, John Luffman of 60 mm diameter (66) and Aristide Perrot at 50 mm square (94) are among the smallest.
Topography
A map is a topographical drawing and, while being drawn to an accurate horizontal scale, should still show those features which cannot be seen from the vertical viewpoint. The map-maker, from the first, introduced or copied conventional signs, pictures and symbols.
Saxton’s map (1) illustrates many of these signs in their first form: rivers run from a single line to the double line of both banks; woods are shown by single trees; hills are shown by sugar-loaves shaded on the east side. These loaves vary to satisfy the engraver’s taste: alpine mountains for Jansson (11), clefts for Blome (14) and joined-in lines by Thomas Kitchin (34). They were omitted by some, especially Benjamin Donn (44, 45), and those who probably - and correctly - did not like the idea of the multi-molehills. But as a convention it remained until Cary abandoned it in the 1790s. In 1801 Charles Smith’s atlas (61) introduced hachuring which was then used for larger-scale maps to become fully conventionalised and improved by the ordnance survey.
Saxton’s towns were shown by a small group of buildings, with church and spire, villages by a church only, while Exeter has a cathedral spire and cross. The churches often contained a circle to show the actual town centre. Houses, the seats of the gentry, have a crenellated block or tower. It is interesting to note that Plymouth, though named, has its symbol on St. Nicholas (now Drake’s) Island. William Kip (5) improved and enlarged the town symbols but still showed Plymouth in the Sound - a fault corrected by John Speed.
On small-scale maps town symbols became simpler and more conventional with smaller places shown only by a circle. But on larger scale maps, such as Bowen’s map of 1754 (37), block plans of streets and buildings began to be used. In 1720 Bowen had also introduced the pegged asterisk to show the number of members returned to parliament (24).
At first the sea was either stippled, plain or had the Flemish shotsilk technique, or zig-zag effect. Saxton and Kip employed the former and the latter first appeared on Keere’s map (4), was added to John Speed’s later issue of 1614 (6.3) and is finally found on John Bill’s map of 1626 (8). This sea-infill was not used by either Jansson or Joan Blaeu. Form-lines, where the sea-coast shading is drawn parallel to the coast suggesting contours, appear first on Thomas Badeslade’s map of 1741 (27).
Patrons and the landed gentry were flattered not only by dedication or armorial shields, but by the pictorial insertion of a ring round their parks (dotted by Saxton, but a proper fence by Speed) and by name on Donn’s survey.
Colouring
Colouring was usually undertaken at the purchaser’s request. For shields standard conventions were used, either letters or hatching or both. For example 0 stood for Gold or Yellow and the area was dotted. The Dutch, Jansson (11), Blaeu (12) and others, reversed the red and blue convention. For the map itself there were also standards: boundary lines were shown in different colours on each side, sometimes with areas colour-washed; woods and seats were green; rivers and the sea, or just the sea-coast blue; towns were red. All else was left to the colourist’s imagination. It is difficult without experience to judge whether or not the colour was original or early. Early greens can sometimes be an indication, with the penetration through the paper caused by the acidity of the verdigris mixture. However, good colour added later does not usually affect the price and collectors can choose for themselves whether to buy a map coloured or uncoloured.
Dating
Plates passed from hand to hand, publisher to publisher: dating a detached map can be extremely difficult. Once engraved an impression can be taken at any time. Some original plates still exist: a map plate by Cary was successfully reprinted only a few years ago; and a plate believed to come from an early version of Saxton’s wall map has been found in printable condition.
One can establish that a print comes from an engraving partly by feel and partly by the recess formed by the plate, and one can also ascertain that the paper was hand-made. Together these establish authenticity but not a date. A watermark is a help and a guide, but only to the manufacturer’s screen. Most dating must be terminus post quem ‘later than’. A date, the signature of surveyor or engraver, the imprint of the publisher all indicate, like the watermark, only the earliest possible date.
If we find the same map within a bound atlas it can be dated by the title page; but even this dating is unreliable. Atlases were often reprinted with previous title pages unchanged. Atlas bibliographers realise this and often note the issue date as distinct from the title date. This other date is often found from the publishers’ advertisements, entries in the term catalogue, or from other dates in prefaces, within the text or on other maps. Sometimes atlases were combined or bound together, and knowing the date of the second can also date the first. Speed’s Theatre and Prospect of the most famous parts of the World, and the miniature Speed issues of Keere are good examples.
But all of this does not necessarily date the map. There are many instances of atlases using previously printed maps. Paper and printing costs were high and publishers would often bind in earlier sheets. There are many copies of Cary’s New and Correct English Atlas of 1793 with maps from the 1787 issue. And many an atlas was a compilation or, to use that delightful word, a factice - sheets gathered together from various sources. The Overton Atlases of the early l8th century are good examples, often containing a mixture of Speed, Blaeu and Jansson maps.
Other more important dating guides are the alterations to the print, additions and erasures, corrections and embellishments, and also the text of the atlas or history when that is printed with or behind the map. A good example of a print change is Speed’s Devon (6) where the imprint is added and later altered by each subsequent publisher (numerous times); the sea is at first plain, then shaded (from 1614); an extra coat of arms is added (in 1676) and Roman and ancient British names introduced (from 1623). The text on the reverse of these maps also changes. But a better example of this latter point can be seen in Keere’s map of 1605 (4). Although the map underwent only one major change (the title was anglicised in 1619) and one minor alteration (the page number changing from 7 to 9 in 1627): the different texts on the reverse help to identify the particular edition, as the text was reprinted frequently (currently there are thought to be nine proper editions plus collections of the early printings).
The following table gives clues to the date of the edition:
| |
1627 |
1627 (32) |
1627 (46) |
1665 |
1676 |
| position of vulgar |
vul- 1st |
1st line |
1st line |
vul - 1st |
2nd line |
| |
gar - 2nd line |
|
|
gar - 2nd line |
|
| spelling of Ptolomy |
Ptolemie |
Ptolomie |
Ptolemy |
Ptolomy |
Ptolomy |
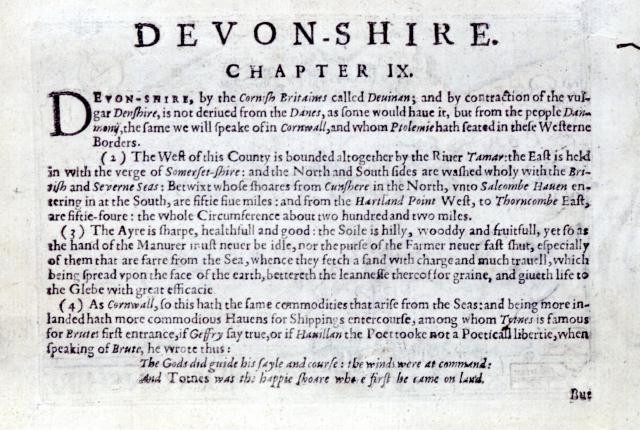
4.4 v. den Keere England Wales Scotland and Ireland Described reverse text (1627)
Note placement of Vul-gar (two lines) and spelling Ptolomie.
Additionally, paragraph numbers were not in brackets for the 1627 (46) edition. A final estimate of age can be made from the condition of the plate, its wear and tear. The quality of the print deteriorates with the number of impressions taken; later copies will be fainter. Sometimes plates are touched up and lines strengthened as can be seen on the Speed copy of 1743. Sometimes the plate cracks, an irreparable state which will show on any subsequent printing. The Keere map shown above (4) finally developed three cracks, all visible on the 1646 edition. Although the appearance of these cracks has been suggested as a means for dating editions, they can at best help to date individual maps. Whereas Skelton identifies two cracks in Devon from 1646 and three from 1662 it has been noted that some later editions have less: there are none at all in a British Library copy of 1646, there are only two in the Whitaker copy of 1662, and only two in the Royal Geographical Society copy and a private copy of 1668 showing that atlases were made up from prints in various states. Dr Almond believes the crack to the Devon map begins from 1676.
Dating is the sum of all of these aspects but at the best can only be approximate and still a case of ‘it cannot be earlier than’.